Lognormalizer
Lognormalizer is a sample tool which is often used to test and debug rulebases before real use. Nevertheless, it can be used in production as a simple command line interface to liblognorm.
This tool reads log lines from its standard input and prints results to standard output. You need to use redirections if you want to read or write files.
An example of the command:
$ lognormalizer -r messages.sampdb -e json <messages.log
Command line options
-V
Output version information, including information about the installed version of liblognorm and its optional features. So this may also be used to check the currently installed library version.
-r <FILENAME>
Specifies name of the file containing the rulebase.
-v
Increase verbosity level. Can be used several times. If used three times, internal data structures are dumped (make sense to developers, only).
-p
Print only successfully parsed messages.
-P
Print only messages not successfully parsed.
-L
Add line number information to events not successfully parsed. This
is meant as a troubleshooting aid when working with unparsable events,
as the information can be used to directly go to the line in question
in the source data file. The line number is contained in a field
named lognormalizer.line_nbr.
-t <TAG>
Print only those messages which have this tag.
-T
Include ‘event.tags’ attribute when output is in JSON format. This attribute contains list of tags of the matched rule.
-E <DATA>
Encoder-specific data. For CSV, it is the list of fields to be output, separated by comma or space. It is currently unused for other formats.
-d <FILENAME>
Generate DOT file describing parse tree. It is used to plot parse graph with GraphViz.
-H
At end of run, print a summary line with number of messages processed, parsed and unparsed to stdout.
-U
At end of run, print a summary line with number of messages unparsed to stdout. Note that this message is only printed if there was at least one unparsable message.
-o
Special options. The following ones can be set:
- allowRegex Permits to use regular expressions inse the v1 engine This is deprecated and should not be used for new deployments.
- addExecPath Includes metadata into the event on how it was (tried) to be parsed. Can be useful in troubleshooting normalization problems.
- addOriginalMsg Always add the “original-msg” data item. By default, this is only done when a message could not be parsed.
- addRule Add a mockup of the rule that was processed. Note that it is not an exact copy of the rule, but a rule that correctly describes the parsed message. Most importantly, prefixes are appended and custom data types are expanded (and no longer visiable as such). This option is primarily meant for postprocessing, e.g. as input to an anonymizer.
- addRuleRulcation For rules that successfully parsed, add the location of the rule inside the rulebase. But the file name as well as the line number are given. If two rules evaluate to the same end node, only a single rule location is given. However, in practice this is extremely unlikely and as such for practical reasons the information can be considered reliable.
-s <FILENAME>
At end of run, print internal parse DAG statistics and exit. This option is meant for developers and researches which want to get insight into the quality of the algorithm and/or how efficient the rulebase could be processed. NOT intended for end users. This option is performance intense.
-S <FILENAME>
Even stronger statistics than -s. Requires that the version is compiled with –enable-advanced-statistics, which causes a considerable performance loss.
-x <FILENAME>
Print statistics as a DOT file. In order to keep the graph readable, information is only emitted for called nodes.
-e <json|xml|csv|raw|cee-syslog>
Output format. By default, output is in JSON format. With this option, you can change it to a different one.
Supported Output Formats
The JSON, XML, and CSV formats should be self-explanatory.
The cee-syslog format emits messages according to the Mitre CEE spec. Note that the cee-syslog format is primarily supported for backward-compatibility. It does not support nested data items and as such cannot be used when the rulebase makes use of this feature (we assume this most often happens nowadays). We strongly recommend not use it for new deployments. Support may be removed in later releases.
The raw format outputs an exact copy of the input message, without any normalization visible. The prime use case of “raw” is to extract either all messages that could or could not be normalized. To do so specify the -p or -P option. Also, it works in combination with the -t option to extract a subset based on tagging. In any case, the core use is to prepare a subset of the original file for further processing.
Examples
These examples were created using sample rulebase from source package.
Default (CEE) output:
$ lognormalizer -r rulebases/sample.rulebase
Weight: 42kg
[cee@115 event.tags="tag2" unit="kg" N="42" fat="free"]
Snow White and the Seven Dwarfs
[cee@115 event.tags="tale" company="the Seven Dwarfs"]
2012-10-11 src=127.0.0.1 dst=88.111.222.19
[cee@115 dst="88.111.222.19" src="127.0.0.1" date="2012-10-11"]
JSON output, flat tags enabled:
$ lognormalizer -r rulebases/sample.rulebase -e json -T
%%
{ "event.tags": [ "tag3", "percent" ], "percent": "100", "part": "wha", "whole": "whale" }
Weight: 42kg
{ "unit": "kg", "N": "42", "event.tags": [ "tag2" ], "fat": "free" }
CSV output with fixed field list:
$ lognormalizer -r rulebases/sample.rulebase -e csv -E'N unit'
Weight: 42kg
"42","kg"
Weight: 115lbs
"115","lbs"
Anything not matching the rule
,
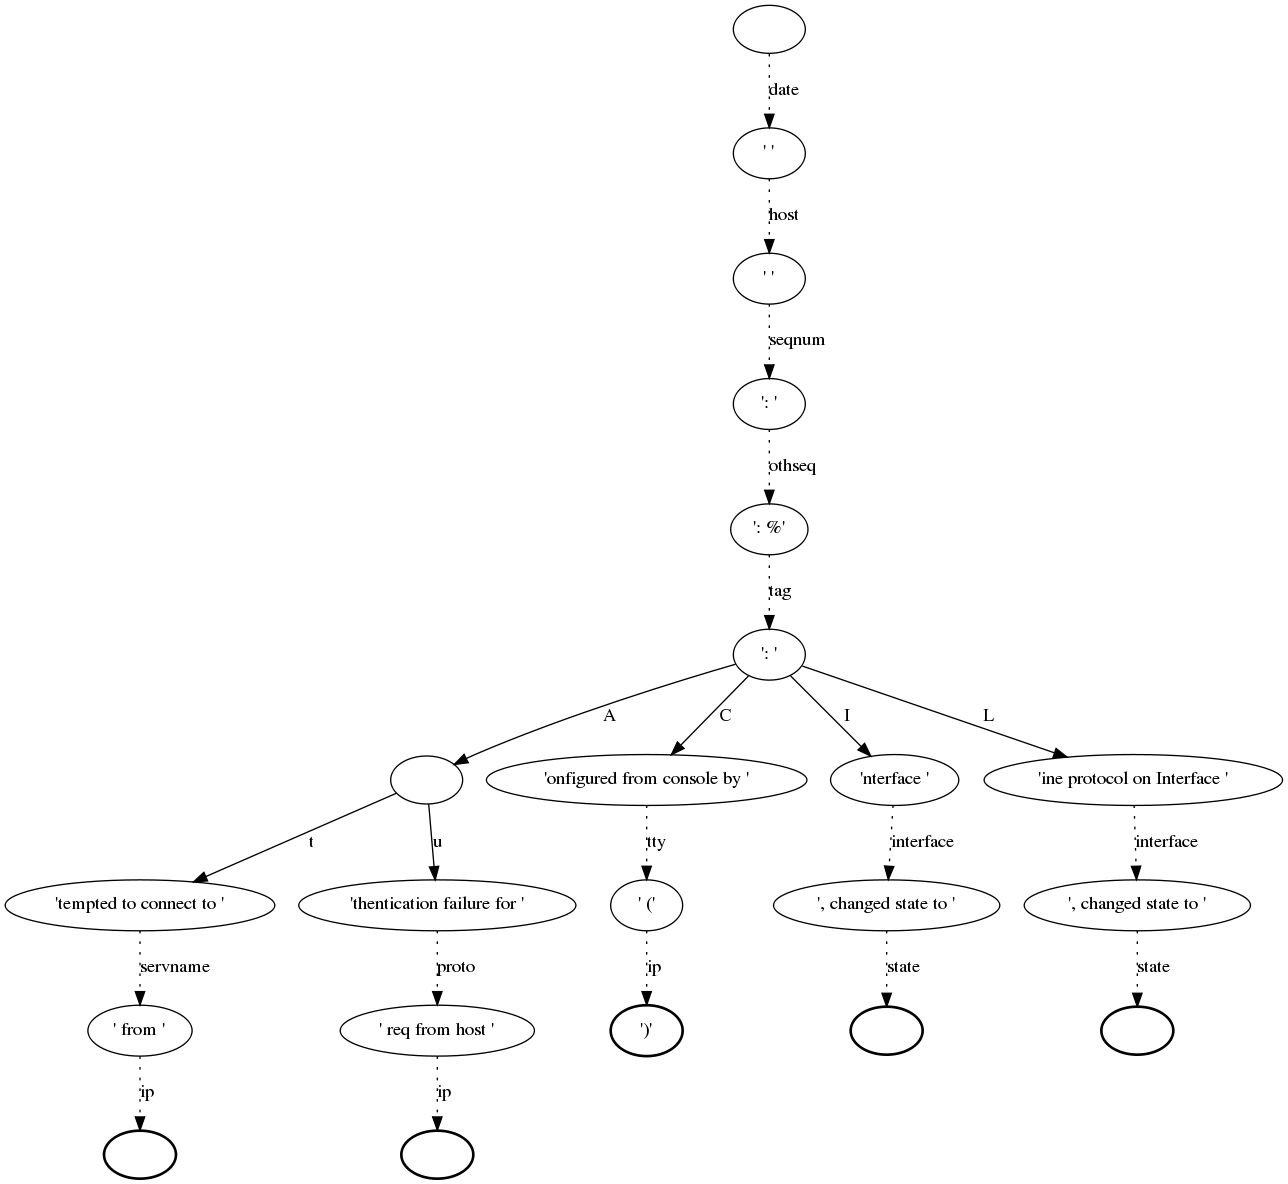
Creating a graph of the rulebase
To get a better overview of a rulebase you can create a graph that shows you the chain of normalization (parse-tree).
At first you have to install an additional package called graphviz. Graphviz is a tool that creates such a graph with the help of a control file (created with the rulebase). Here you will find more information about graphviz.
To install it you can use the package manager. For example, on RedHat systems it is yum command:
$ sudo yum install graphviz
The next step would be creating the control file for graphviz. Therefore we use the normalizer command with the options -d “prefered filename for the control file” and -r “rulebase”:
$ lognormalize -d control.dot -r messages.rb
Please note that there is no need for an input or output file. If you have a look at the control file now you will see that the content is a little bit confusing, but it includes all information, like the nodes, fields and parser, that graphviz needs to create the graph. Of course you can edit that file, but please note that it is a lot of work.
Now we can create the graph by typing:
$ dot control.dot -Tpng >graph.png
dot + name of control file + option -T -> file format + output file
That is just one example for using graphviz, of course you can do many other great things with it. But I think this “simple” graph could be very helpful for the normalizer.
Below you see sample for such a graph, but please note that this is not such a pretty one. Such a graph can grow very fast by editing your rulebase.